
BLOG

BI | 7 Valuable Tips for Power BI
Power BI is Microsoft’s interactive data visualisation and analytics tool for business intelligence (BI). Power BI is used to pull data from a wide range of systems within the cloud to create dashboards that track the metrics you care about the most, or drill in and (literally) ask questions about your data. Power BI allows you to create rich reports or embed dashboards and reports into reporting portals you already use.
Power BI is Microsoft’s interactive data visualisation and analytics tool for business intelligence (BI). Power BI is used to pull data from a wide range of systems within the cloud to create dashboards that track the metrics you care about the most, or drill in and (literally) ask questions about your data. Power BI also allows you to create rich reports or embed dashboards and reports into reporting portals you already use! How good is that! The dashboards, reports and visualisations you can create go far beyond bar and pie charts, but what’s even better is that you don’t need to be a designer to use them. Here at Advance Business Consulting we have shared 7 valuable tips that will help you gain greater insights from the information you already have, in more areas than you might expect.
Let's get into it.
1. Visualise the services you use
Power BI is easily accessible with Microsoft, but what you may not know is that it has hundreds of content packs, templates, and integrations for hundreds of data services and apps—and not just Microsoft ones like Dynamics 365 and SQL Server.
Connect your apps to data
Data is at the core of every app. We make it easy to get your data into your apps with over 200 connectors for many popular cloud services and even your on-premises data.

For example, if your business uses Xero for accounting, K2 Cloud to build business processes, Adobe Marketing Cloud, SAP HANA, Salesforce, MailChimp, Marketo, Google Analytics, or even GitHub, Power BI can be used to visualise the data in those services, create reports against them, and bring them together in a custom dashboard—a CEO's dream!
What's also great is the ability to set up the on-premises gateway to use Power BI to explore data sets on your servers. That way you can compare website visitors with sales, or see which promotions have brought in new customers. You can create your reports and visualisations, perform calculations (Power BI calls these calculated measures) and set access levels for individual users, data sources, or specific dashboards and reports to control who can view more sensitive information.
2. Tell stories with your data
We all know charts are great for numbers, but if you want to show information that changes over time in a way that’s easier to understand, try the new Timeline Storyteller custom visual for Power BI. This allows you to create a linear list of dates or times or lay them out in circles, spirals, grids or custom shapes. You can also show a chronological list, a sequence that shows the duration of events, or pick relative or logarithmic scales. Pick how to best represent, scale and lay out your data and Power BI will build a timeline from it; use that to tell the history of your business, show how demand is growing, or explain anything else in which the sequence of events matters.
3. Explore ‘What-ifs’
You can spend time comparing different scenarios in Excel, but Power BI lets you do it by dragging a slider bar to show changes. Add a calculated measure for a figure such as revenue and you can use the New Parameter button in Power BI Desktop to add parameters that change in your What-if scenario – setting the data type, minimum, maximum and increments. That creates a calculated measure that you can reference in other calculated measures; so if you create a What-if parameter for the number of customers who respond to a particular promotion you can plug that into a formula that you create to show how many customer support tickets you can expect to have to deal with. Tick “Add slider to this page” in the What-if parameter dialogue to add a slider bar that you can drag to show the difference when the number of customer responses is higher or lower. Forecasting has never been easier!
4. Ask questions in real time
Instead of designing charts and reports, use the natural language features of Power BI to ask questions and get visualisations in response. You can specify the way the data is presented — ask for “total sales by region by month as a line” — or let Power BI pick a layout that suits the data with a more general question like “What were the sales numbers for last quarter?”.
If there are tiles pinned to the dashboard, Q&A will suggest those as questions, and as you type a question it will suggest terms you could add based on the tables in the data set. If the question turns out to be extremely useful, you can pin the visualisation to the dashboard, making this an easy way to create visualisations for a data set. If you own the data set, you can also add featured questions in the dashboard settings. Q&A uses the names of tables, columns and calculated fields in the data sets; if the column is called area rather than region, you’d need to ask for “sales by area” unless you add synonyms, and table names like CustomerSummary will make Q&A less natural than names like Customers (even though Q&A would know that’s the table you want if you ask about “customer summaries in Chicago” because it can break words up and understand plurals).
Power BI Q&A works on the Power BI website and the iOS Power BI app. It can work on data stored in an Excel table (or in a database via the on-premises gateway if you enable Q&A for the data set) or you can use Power Pivot to optimise the data set for Q&A. Make sure all the tables in your data set are joined correctly, check data types for dates and numbers, and create the default field set for columns and default label for tables to tweak the columns displayed and the type of graph or chart Q&A will show.
5. Implement custom visualisations
Power BI includes a good range of visualisations, and you can add more, either by downloading them from the Microsoft Store or by creating your own with the open-source Power BI Custom Visual Tool (which uses CSS, TypeScript and NodeJS). Don't stress, our team is experienced in implementing custom reporting for you.
The Office Store includes visualisations from Microsoft, like word clouds, a correlation plot based on R script, chord charts to show interrelationships in a circular matrix, the “box and whisker plot” that highlights outliers, clusters and percentiles to show data that might otherwise get lost in summarised figures like averages, as well as visualisations created by other Power BI customers.
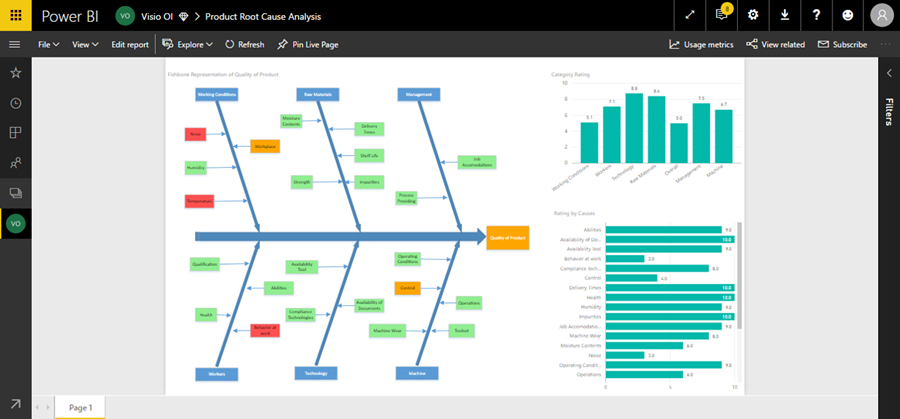
You can also link Visio diagrams to Power BI to use those as custom visuals, if you want to analyse progress through workflows and processes. If you have Excel analytics models, you can use Frontline’s Analytic Solver to turn them into custom Power BI visualizations without having to design the custom visual in JavaScript. What you get isn’t a static report; it’s a dynamic model that you can drag and drop different Power BI data sets onto to simulate or optimise different options.
6. Fit more data into executive dashboards

It isn't uncommon for different BI users to need different levels of information in their visualisations. Managers and business analysts may want a lot of details, but if your executives are tracking 20 or 30 key metrics, maybe for multiple regions around the world, it’s better to present that at a glance with a simple view that shows the target and the actual figure rather than a more complex visualisation. That way you can look up information quickly in a meeting without getting lost in too many charts and figures. We all know how frustrating that can be! The Power KPI custom visualisation combines multiple report types into a single tile.
7. Power BI works with IT data, too
It isn’t only business users who have large amounts of information they need to shave down for insights; you can use Power BI to visualise data for IT monitoring tools. The Power BI solution template for Azure Activity Logs uses an Azure SQL database and Stream Analytics to collect logs and display them using pre-built Power BI Desktop reports, so you can look at trends in usage and problems. There’s also a set of pre-built Power BI reports for the Intune Data Warehouse that shows device details like configurations and compliance state, and a solution template for System Center Configuration Manager with a dashboard that covers client and server health, malware protection levels, software inventory and which devices are missing updates.
Power BI's flexibility also gives users a chance to build their own dashboards and reports for other tools, as long as they can get the data into an SQL Server or Azure SQL database. This is a game-changer!
Advance Business Consulting is experienced in Power BI implementation, to learn more about how it can assist your business, contact us today!

WHITEPAPER | Excel or a Business Intelligence solution? When is it just better to stick with Excel.
Excel and BI tools are great tools for your business, but when is each more suitable?

Microsoft Excel has been a pillar of business since the late 1980s, and since then, it’s only grown in its usefulness and relevance to modern business. However, as businesses’ requirements for analysis and reporting grew, along with increases in the volume and sources of data, Excel began to struggle.
In the past few years, we’ve seen an evolution of the tooling into Business Analytics (BI) platforms. These platforms use modern programming languages and data storage techniques to speed up and automate repeated tasks, removing human involvement and reducing overhead on a business.
Despite what evangelists from both sides preach, both Excel and BI tools have their place in modern business. Knowing when to leverage each toolset can save time, effort, and cost –leading ultimately to better, faster, and more accurate decision-making.
In this paper, we look at both sides of the story and highlight when switching to BI tools can improve business outcomes and when it’s best to stick with Excel.
To discuss how to capture, manage and understand your data, leave your details below and an expert will get in touch with you.
Or call us on +618 8238 6500
BI | Why you need a plan to implement business intelligence.

You want to get the most value out of any new business system implementation. Whether its new insights, automating management reports, a new operational dashboard or some predictive analytics to help make better decisions.
From our experience, a roadmap and some planning before you start development will help avoid the common issues that can cripple a business intelligence project. Resolving a disconnect with a major stakeholder halfway into a project is a challenging situation and it can be financially costly and bad for customer satisfaction.
At Advance, we’ve been working on implementing business systems for over 20 years and have seen it all. We’ve picked up the pieces of some very poorly implemented projects. Many of the challenges are common to all projects and some simple planning in the beginning will provide the best opportunity for a successful outcome.
Avoid the common traps and follow these steps. Spending some time on good planning early on will pay off in the long term.
1 - Get the main stakeholders in the same room.
Set up a short 1-hour meeting, outline the benefits and examples of successful BI projects. Get people excited about the project and what it will deliver. BI can free employees from manual, inefficient and low-value work. Managers can keep their team accountable and gain new insights on performance. Business owners can see key performance indicators instantly, even on their mobile devices. Mobile BI with instant messaging can provide an avenue for instant feedback so you can begin corrective actions.
Getting the key stakeholders onboard early is a major success factor to any project.
2 - Agree on the key problems you want to solve

There will be several problems you want to solve. Agree with the stakeholders on the 5 most important problems they want to resolve.
Write them down, define how the ideal solution looks, is it measurable, achievable, timely. It needs to be measurable!
Based on the discussion, prioritise. Depending on the feedback you might pursue a quick win, like automating a daily report or look at something bigger like a new dashboard linking a number of key business systems. BI will provide an opportunity to connect data from different sources like Excel, SAP, MYOB, Xero and Salesforce for example. This means you can get a holistic view of the business and connect data, something that was not possible with data silos.
3 - Agree on how success is measured with Key Performance Indicators (KPIs)

Think of KPIs as the mechanism to make effective, data-driven decisions. You are far more likely to improve what you can measure. This is what underpins a successful data driven business
Agreeing on the right KPIs will help in driving the efforts of the company towards a meaningful outcome. To rally the team, you need to measure the right things.
Don’t share too many KPIs, as a data analyst you will lose your audience and overwhelm the typical employee.
KPIs vary from each department. Agree on something achievable like 10 KPIs max. Below is a list of common finance KPIs relevant to most businesses:
• Working capital
• Operating cash flow
• Return on equity
• Quick ratio
• Debt to equity ratio
• Inventory turnover
• Accounts receivable turnover
• Gross profit margin
4 - Data
Getting access to the data is one of the first steps to building a BI solution. Map out the various systems used and get the ball rolling early on whether you have direct access or what data APIs will provide.

Access to the data can hold up any project. Dive in early to assess what you can get.
We say do this early as some systems will provide different levels of access and data quality. More mature enterprise systems like SAP will more likely provide access to everything you need while other less mature vendors often need far more manipulation to get what you need. Perfect data is unlikely and getting access as soon as possible will help reduce delays caused by waiting on 3rd party vendors.
A good data management framework will help to get the best possible data, the best data you can get will directly impact on insights. Test the answers and iron out any inconsistencies before rolling out the solution to a large audience.
Trust is hard to win back if the new system is not showing accurate information. Don't let this happen, if there is an issue, acknowledge it and resolve it.
5 - Action

Deploying a new system should drive new insights, new actions and opportunities. Use the new insights to make a positive step forward. Set up a system to action the data and new insights. First - Automate the delivery of reports, and have a clear strategy on what employees should do with this information. For sales teams, a weekly dashboard of KPIs will drive behaviours and actions. Make the most of this opportunity to get the team excited about new insights. Ensure the time to action KPIs is managed with clear deadlines.
Final Thoughts
Even if you achieve only a couple of the steps above, you will increase the likelihood of deploying a successful business intelligence solution.
We haven’t touched much on the software for BI and this really comes last. Each tool has its strengths and we tend to lean towards Power BI and Qlik just to be transparent. Most modern BI tools can get the desired outcome and some planning early in the cycle will make a big impact.
Like to know more? Contact us here or check out our blog on two leading BI solutions - Power BI and Qlik - Some interesting changes at Qlik and what to look for in a business intelligence solution.
BI | Drowning in Excel reports. Employee retention. Some unexpected benefits from deploying a business intelligence platform like Power BI and Qlik.

Here is one recent example of how a business intelligence tool can deliver more than just new operational insights.
The client: Multiple systems, multiple sites, time and labour-intensive manual reporting
The result: Timely, automated reports, new insights with an instant feedback portal
Next Steps: Deployed to mobile with chat, user accountability and predictive analytics
Managing a business is very much about the people that you work with. The clients that rely on our services to run their business and the employees at Advance that are responsible for delivering these business systems. Clients and employees both need to have a good level of customer satisfaction or relationships can fall apart.
It was interesting to hear from my peers about situations where talented employees have left their jobs because of frustrations caused by data overload and using a process that is inefficient, manual, slow and often frustrating. There are times when work will be challenging and that is a part of life, but throwing more labour into a manual process to get the result is not a good long-term solution.
Companies that foster employee growth through technology innovation will improve staff retention. We try to adopt innovative tools early that are good value and this means our team is always learning new skills. The users of these solutions on the client side are eager to adopt a new system if it makes their work life easier and more productive.
Employee satisfaction and retention was an unexpected benefit from deploying a successful business intelligence platform.
Below is a BI solution we have been working on which is quite a common example where daily reporting is needed and there simply aren’t enough hours in a day to manually pull all of the data from the various branches and the 30+ systems. This type of reporting will cause frustration to any employee, especially if they are tasked with manually accessing each branch early every morning to build a complete view of the businesses performance.
The Challenge
Multiple sites, often in the double digits. 30 sites are not uncommon
Multiple disparate business systems across different locations, systems like Xero, MYOB, SAP, many others for HR functions and client facing systems
Be aware that although powerful, API’s are not built equally and something that performs well in a mature system like SAP may not provide the same data and consistency in something like MYOB. The ability to manipulate the data is a critical aspect of connecting multiple data sources
Time-consuming and labour-intensive manual reporting
The window for generating daily reporting not big enough to generate reports on time
Sites spread across multiple geographies and time zones
Manual, static Microsoft Excel reports to consolidate data into PowerPoint and then emailed each day

versus

Using Traditional Reporting Encountered Some Of These Challenges
Hardly scalable and very prone to human error
Time-consuming, manual and inefficient
Not a lot of fun. Repetitive tasks
Staff turnover is high
Inefficient with no automation
Slow
Missed opportunities
No forward projection or predictive analytics
Linking performance to industry systems that benchmark against competitors in the same industry was not possible
Reporting can look inconsistent and not well branded when required for management reporting
A Better Solution
A business intelligence solution connecting all of the systems and data into a single verified view of the truth
Automated, consistent, branded and uniformly formatted reports and dashboards
Dynamic insights that can be queried, drilled down for further detail
Automatic red flag warnings for KPI’s that are underperforming or outliers
Opportunities for further growth in positive KPI’s
Data pulled directly from each system, automatically calculated, verified and disturbed in minutes
Manageable distribution via internal systems like Slack or email to a selected user or group based on title or credentials
Connected to external data sources such as local weather to provide further insights and predictable analytics
Easily managed by employees without any special training
Portal for reporting commentary enabling stakeholder feedbacks
Secure and only the right people have access


The Results
Finance now quickly generate required reporting each day for 9:00AM reviews
Holistic reports for entire business across all 30 locations
New insights for things like revenue vs payroll
Automated reports are distributed each day to key stakeholders
Increased efficiency, productivity and employee satisfaction
Finance can focus on actions versus generating reports
Minimal manual reporting – there is always some needed and the human touch.
Consistent presentation with clear branding
Instant feedback on the numbers via comments on a secure portal
Final Thoughts
A well thought out BI implementation will connect all these business systems and inputs to build accurate business reports and dashboards. Smarter insights and visualisations with automated reporting will reduce risk and provide the feedback needed to manage a business effectively with a holistic view.
Enabling your team with valuable tools will teach them new skills and a reduction in manual inefficient processes will lead to better job satisfaction.
Tools like Qlik and Power BI are powerful, they will pull together all the systems so you can start building meaningful insights. Qlik is remarkably good at this. By linking to virtually any data source will let you manipulate data to build reports without the need for a data warehouse. The benefit is that it is more cost effective, quick to get answers, often within days not weeks. We have connected to a clients systems in a demonstration right there on the spot and built a report from a live system which is very compelling. Speed to new insights and value is a key benefit when using a tool like Qlik.
A Common Question
How do you get started? The first step to any project is getting access to the data.
If you would like to know more or have any questions about BI, get in touch with us here. We are passionate business intelligence experts.

CONTACT OUR SALES TEAM - NIK VILLIOS | ACCOUNT EXECUTIVE
PHONE: +618 8238 6521
MOBILE: +61 408 800 753
EMAIL: NVILLIOS@ADVANCE.NET.AU

BI | Spike In Demand For Microsoft Power BI - Here's Why
There has been a big spike in the demand for business intelligence solutions, the bulk being for Microsoft Power BI and Qlik.
We review and analyse our enquiries each week to see what our clients are interested in and what challenges the broader market is trying to solve. Business intelligence and new insights is our thing after all.
Unsurprisingly there has been a big spike in the demand for business intelligence solutions, the bulk being for Microsoft Power BI and Qlik.
One of the projects we are working on this week is to provide a detailed financial reporting system from the popular Xero accounting system. Xero is a great tool but our clients are telling us that they cannot easily get the level of detail and analysis they need. The data is there but there is no easy way to get more complex insights. Power BI can help.
If you would like to know more about business intelligence or Microsoft Power BI and what it can do for your business, reach us here
Here are some of the reasons why there is a demand for Microsoft Power BI
Peer Insights Matter - Microsoft has a 4.3 rating at Gartner Peer Insights with over 1300 reviews today and received the Customers Choice 2018 award from Gartner. This is important not just because Gartner is a leading research and advisory company but also because the very people that use the tool have provided a review. Look for the genuine reviews, it’s one good source for critical honest feedback. Take a look here.
Australia has a big Microsoft presence and existing clients can access Power BI at a low cost. The desktop version is free for individual users. This makes it pretty attractive to consider using Power BI.
Wide User Base Appeal - Power BI is targetted at non-data scientists, business analysts as well as power users like developers and data scientists, this means it appeals to a big audience. We work with customers that are power users and self taught BI users, generating their own powerful insights for their business units. The support community is very active and helpful.
Power BI can easily capture and assemble data and access diverse data sources, particularly other Microsoft tools and platforms.
Tight integration with Office 365 products, Azure cloud, Dynamics 365, Salesforce, SQL DB, Excel, and SharePoint.
Analysts have judged Power BI to be a leader. Don’t buy into the hype but also don’t discount genuine endorsements. Current users are also some of the best people to give you an honest review.
Microsoft has been investing in its Marketing efforts globally and this is creating awareness and demand, this is not a bad thing. Microsoft believe in their product which is backed up by monthly enhancements and updates. Many integration companies and end users agree. There is real investment in this tool.
These are just some of the reasons why people are looking at Power BI. Microsoft is investing heavily in the tool to stay ahead of its competitors and is releasing major updates regularly.
Is Power BI the right tool for you? There are many things to consider and we will discuss this in an upcoming blog. Which BI tool is right for you.
Below is a great overview of the major Power BI updates for March:

Big Data | Make Better Decisions: Don’t Buy Into The Big Data/Small Data Hype
Learn why the data science on big data isn’t as good as you think. Discover why the data science business is struggling to beat small data.

Simulated Gas Leak Fire - Training Centre at Brukunga, South Australia. Photo Taken by Megan Rogerson
Did you know you aren’t supposed to put out an electrical fire with water?
The reason is that the electric current can flow back up with the stream of water and electrocute you.
With a LPG fire you actually want to isolate the gas and not extinguish the flame.
This is because if you extinguish the flame, you can create a much more dangerous environment where you lose sight of the leak and there is also the potential for a deadly explosion.
Despite this, people still get hurt with trying to extinguish common fires for two main reasons:
They apply the wrong information to their decision making process (that water puts out all fires)
They don’t have all the details (that the fire is electrical or a gas leak in the first place)
Another reason is that they are human and they panic! Dealing with a fire is a stressful situation, if you have ever been in this situation you will know that it is easy to make a bad decision based on what you believe is the right thing to do. Fire progression is rapid and ferocious.
Businesses experience the same issues when using big data.
First, let me define these two terms. Small data is data that is 'small' enough for our consumption and importantly it is actionable, informative and accessible. Big data relates to data sets that are far too large and complex for humans or even traditional software systems to deal with.

Why data science fails
Data science fails most businesses because people tend to ‘cherry pick’ and use data to:
Confirm bias
Observe patterns that aren’t there
Make decisions based on non-cohesive data points
The worst part is they don’t know they are doing it! Just like people who don’t know their fire is an electric one and try to douse it with water, businesses end up hurting their revenue when they make decisions.
So what’s the solution?
Small data is one of the answers, here’s why.
The Cunning Beauty Behind Small Data
To understand the impact small data has, we need to understand the issues with big data and the data science business.
Big data is a popular term and there is lots of hype around it. Every major software vendor has added it to their marketing campaigns and it is also psychologically appealing.

We are trained from an early age to believe there lies a strength to numbers. In fact, from an early age, we are socially branded to think this through phrases like,
‘The more the merrier.’
Our minds are programmed to look for patterns. With big data that can be a problem.
When looking at big sets of information, you get the opportunity to identify lots of patterns.
Not only that. The bigger the data, the greater the chance of being able to draw the connections you want to see, even when they aren’t there.

This practice is so common it has a name: Analytical Bias
To be fair, the data science business tries to combat this. The issue is that by the time the message gets from the data driven business to the regular business, it is either watered down, too late, or forgotten altogether.
Another issue with large data is its momentum.
Big data is slow by its very nature. By the time most companies can finally use it, the content can be dated or no longer viable.
To combat this, you need your data to be accurate and current so you can make business decisions in real time.
Why businesses love the agile nature of small data

Businesses that leverage small data can quickly adopt it into their business and for good reason.
Small data is agile.
With small data, you can assess market need, interest, and viability in real time and decide if you want to profit as an early adopter, or save your investment for a better alternative or opportunity.
Small data is bite sized pieces of information that you can digest and act upon. This is one of the reasons why businesses love small data. Small data is actionable.
Final Thought
Complex large data set analysis is important. Big data is an interesting topic and its potential is compelling, just don’t buy into the hype and don’t pursue it until you’ve done the easy stuff first.
With small data you can have a quicker ROI with some easy wins right away, and valuable insights can be gained with powerful, inexpensive tools and techniques.
Tools like Qlik and Microsoft Power Bi make it quite easy to answer important questions quickly. You don’t have to wait a long time to get the right answers and useful dashboards can be built in just a few hours.
If you’d like to hear more, join our mailing list to get regular updates, articles, ideas, and announcements from the front lines of the data industry.
We work with clients each day to provide valuable insights into their business. This week we are building a new dashboard using Power BI for monthly management reporting.
If you’d like to get in touch or comment on an of my blogs you can reach me directly via my contact details below.
Many Thanks, Jp.
John-Paul Della-Putta
Director
Phone: +61 8 8238 6500
Email: jp@advance.net.au
LinkedIn: www.linkedin.com/in/johnpaul
Website: www.advance.net.au