Introducing KPI Pulse
Just over a year ago, I experienced a couple of light-bulb moments...
- Not everyone is, nor do they want to be, a data analyst – it might sound obvious, but the way that everyone accesses and consumes data can vary dramatically, even if they perform similar roles. I found that some people would like to view data in table form, like a big spreadsheet; these are generally financial, accountant types. Sales and entrepreneurial types liked big numbers and graphs.
- More work is being done away from our desks; at coffee shops or at client meetings. Therefore, having easy access to important metrics and data isn’t always possible.
- Many operational staff regularly like an emailed report, only to open it up and search for an issue or a value that needs their attention.
I thought, how can I take QlikView (or Qlik Sense, Excel and more, for that matter) and make it easily available to anyone, so that they can consume the information the way they want to?
.jpg)
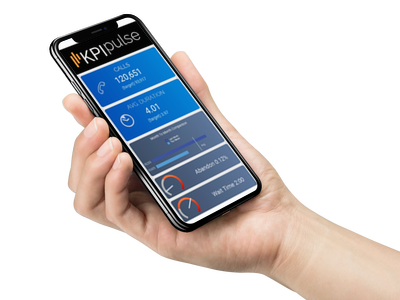
The idea of KPI Pulse was created!
The concept was to have a locally installed publishing application which would automate the reloading of data into QlikView and then allow the designer to create a series of snapshots (they could be images like a graph, a complete dashboard, a data file or even a PDF report). These snapshots would then be available within a mobile app, a website, via email, a desktop app or even within Excel.
KPI Pulse was born!
We can now take QlikView metrics, personalise them for each user and push them up to your own secure cloud server. From there, these metrics are available on our mobile app, email, online Head Up Display, desktop app, Slack and Excel. We can schedule the distribution of key metrics any way you like and get everyone on the same page – aligned with your business performance goals.
Executives and managers can instantly see their own metrics on their phone, without needing to log in. If they then need to share that metric, they easily can with Slack, email or a text message.
You don’t need any extra QlikView licenses, allowing you to easily push metrics to all staff who require them, and even provide metrics within a website to your customers, clients or other stakeholders.

KPI Pulse is easy!
Right from the start, my goal for KPI Pulse was to make it easy to distribute the great work that a QlikView Designer has done, getting relevant metrics to the right people, easily.
One of the great things about QlikView (and Qlik Sense) is that it’s like the Swiss Army Knife; it’s the one package that you need to learn, allowing you to do so much. When looking at other BI solutions, there’s always a stack of tools that you need to learn and use.
Now, with this one easy to use application, the reach and effectiveness of QlikView has become even more powerful.
Watch our quick video!
Contact us today to find out more about KPI Pulse, and what it can do for your organisation.
Or visit our website at www.kpipulse.com